Penda health report
- Tech Stack: R, rmarkdown, Power BI
- Github URL: Project Link
- Full rmarkdown report: click here
- Interactive Dashboard: click here
INTRODUCTION
Penda Health is a leading healthcare provider based in Nairobi with multiple medical centers, offering in-person and telemedicine visits to patients. As part of the data analysis project, I have developed an interactive dashboard to gain insights into visit trends, revenue analysis, and common diagnoses recorded at Penda Health. This report summarizes the key findings from the dashboard and provides recommendations to optimize clinic operations and enhance patient care.
PROBLEM STATEMENT
The primary goal of this project is to analyze Penda Health's data and extract actionable insights to address specific challenges. The key objectives are as follows:
- Identify the clinic's busiest and least busy months to allocate resources efficiently.
- Compare revenue generation between different medical centers to optimize performance.
- Analyze common diagnoses to prioritize patient care and resource allocation.
- Assess patient satisfaction levels and payment methods for insights on clinic performance.
DATA CLEANING AND PREPROCESSING
The dataset provided contained information from three tables: Visit Table, Invoice Table, and Diagnosis Table. During the data cleaning process, the following were addressed; missing values were imputed by mean value, converted the ‘VisitDateTime’ column to the appropriate date format for analysis and finally removed all the duplicated values. I also merged the three tables into a single table for better analysis.
DATA ANALYSIS AND VISUALIZATION
The interactive dashboard provided several visualizations to gain insights into Penda Health's operations:
Total Visits, Revenue, and Patients:
- Total Visits: Ksh. 45.2K
- Total Revenue: Ksh. 76.6M
- Total Patients: Ksh. 28.4K

Monthly Trends of Visits:

The chart above showcases the visit volumes over time. It highlights the clinic's busiest and least busy months, with June having the highest number of visits.
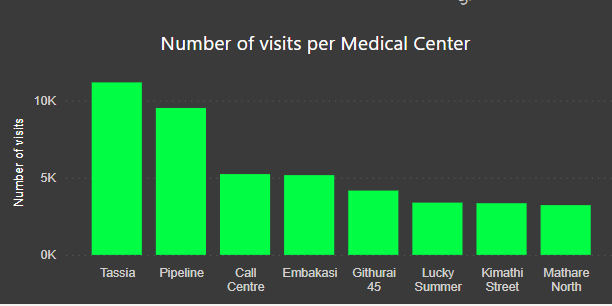
Number of Visits per Medical Center:

The chart above compares the number of visits received by each medical center. "Tassia" stands out as the most visited center, while "Mathare North" had the fewest visits.
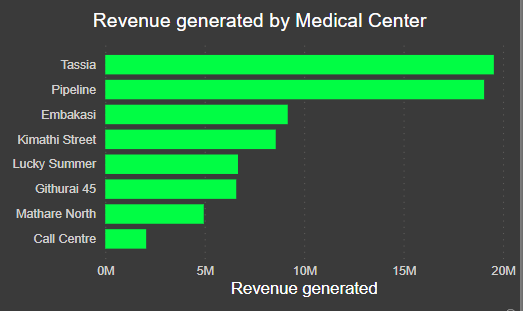
Revenue Generated by Medical Centers:

The chart above illustrates the revenue contributions from each medical center. "Tassia" generated the highest revenue, while "Call Centre" had the lowest contribution.
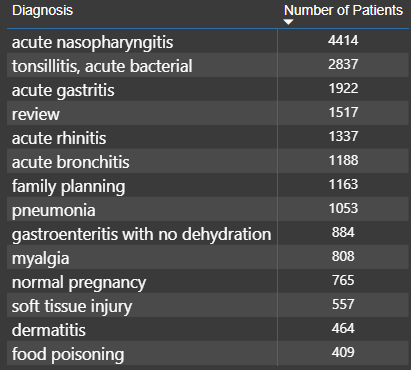
Diagnoses and Total Patients:

The matrix table above presents common diagnoses and the corresponding total number of patients recorded for each condition. "Acute Nasopharyngitis" had the highest number of patients diagnosed (4414 patients).
CONCLUSIONS
The data analysis and visualizations provided valuable insights into Penda Health's operations, patient trends, and revenue generation. The dashboard identified June as the busiest month for the clinic and revealed "Tassia" as the top-performing medical center in terms of visits and revenue. Additionally, "Acute Nasopharyngitis" emerged as the most common diagnosis among patients.
RECOMMENDATIONS
Based on the insights gained, I recommend the following strategies for Penda Health:
- Resource Allocation: Allocate resources efficiently based on monthly visit trends to handle higher patient volumes during peak months such as June.
- Revenue Enhancement Strategies: Implement targeted marketing and service enhancement strategies for high-revenue medical centers like "Tassia" to further boost overall revenue.
- Diagnosis-Specific Care: Develop specialized care plans and allocate resources to manage prevalent health conditions like "Acute Nasopharyngitis" effectively.
- Data-Driven Decision Making: Continue utilizing data analytics and interactive dashboards to drive informed decision-making in resource allocation, revenue enhancement, and patient care.
Final Dashboard Report
